

Cut through the signal clutter
Keep what matters, ditch the rest in your workflows
Pattern recognition built for finance teams, security ops and anyone managing distributed systems.
When you're running critical systems, a single missed alert or too many false alarms can tank your day. SilverSignal sits in your communication flow—Slack, email, incident management tools, deployment logs, whatever you're using—and filters out the noise with the same precision radar uses to track aircraft.
You'll see latency metrics, understand your signal-to-noise ratio, and actually know what miscommunication is costing you. Set your thresholds, focus on what's real, and stop wasting cycles on garbage alerts.
This is for teams that can't afford ambiguity. Clarity isn't a nice-to-have, it's table stakes.
Smart signal filtering
Cuts through the noise by learning what's actually important in your communication channels. Uses pattern recognition to figure out which alerts genuinely need you right now and which ones can wait, all based on how your team actually works.
Response time tracking
Measures how long it takes from alert to acknowledgment and finds where things bog down. Could be a slow detection, routing getting stuck, or just how fast your team can actually respond. Shows you exactly what's eating up your time.
See what confusion costs you
Puts a number on miscommunication. Tells you how many incidents needed fixing after the fact, how many rollbacks happened because of mixed signals, and how many hours went into clarifying something that should've been clear.
Pulls from everywhere you use
Connects to Slack, email, PagerDuty, Datadog, CloudWatch, webhooks—whatever you're already using. No lock-in, no forced migrations. Pattern matching works across all of them at once.
Rules you control
Define what critical means for your team. Set severity levels, keyword patterns, time windows. Change them instantly without touching any code.
Full audit trail and replay
Everything gets logged with source, timestamp, confidence score, and why the filter made that decision. Go back and replay past alerts to check your logic or show someone new how to spot patterns.
Why teams lose hours to noise
A distributed team gets hammered with dozens of alerts every hour. Monitoring tools, incident management, chat—it all adds up. Some of it matters. A lot of it is duplicated or already stale. The alert you actually need, the one that stops a deployment or signals a real security problem, drowns in the pile. That's where the hours go. That's where bad communication gets expensive.
SilverSignal pulls in signals from across your stack and uses pattern recognition to separate real issues from noise. It doesn't just ignore things. It learns what your team actually acts on, what causes rework, and what gets dismissed in seconds. When something critical happens, it gets to the top. Context goes with it. False positives stop polluting your incident log.
The improvement shows up in your metrics. You can measure signal-to-noise ratio by channel. You can see how long it takes from alert to someone actually responding. You can count how many incidents needed back-and-forth messages to clarify—that's your miscommunication tax. Once you see the number, you can change it. Teams typically see faster response times and way fewer rework cycles once the filtering settles in.
Signal filtering in the real world
What it actually looks like when you cut through the noise. These are real examples of teams going from buried-in-alerts to actually knowing what matters in their systems.

Before filtering: over a hundred alerts firing in less than two minutes, most of them echoing each other

After filtering: just the 8 signals you actually need to do something about
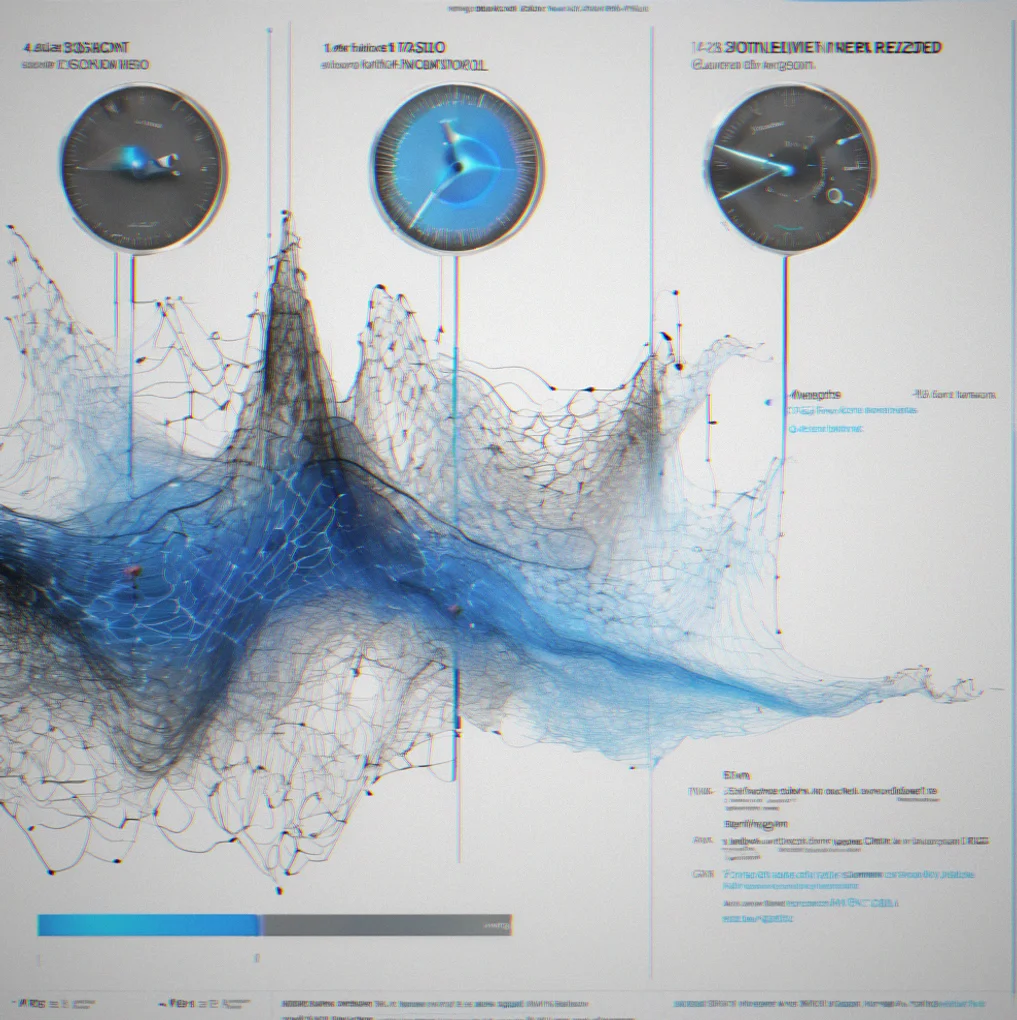
The system spots it in a couple seconds. Getting it routed takes less than a second. Your team's response? Nearly a minute. that gap is where things slip.
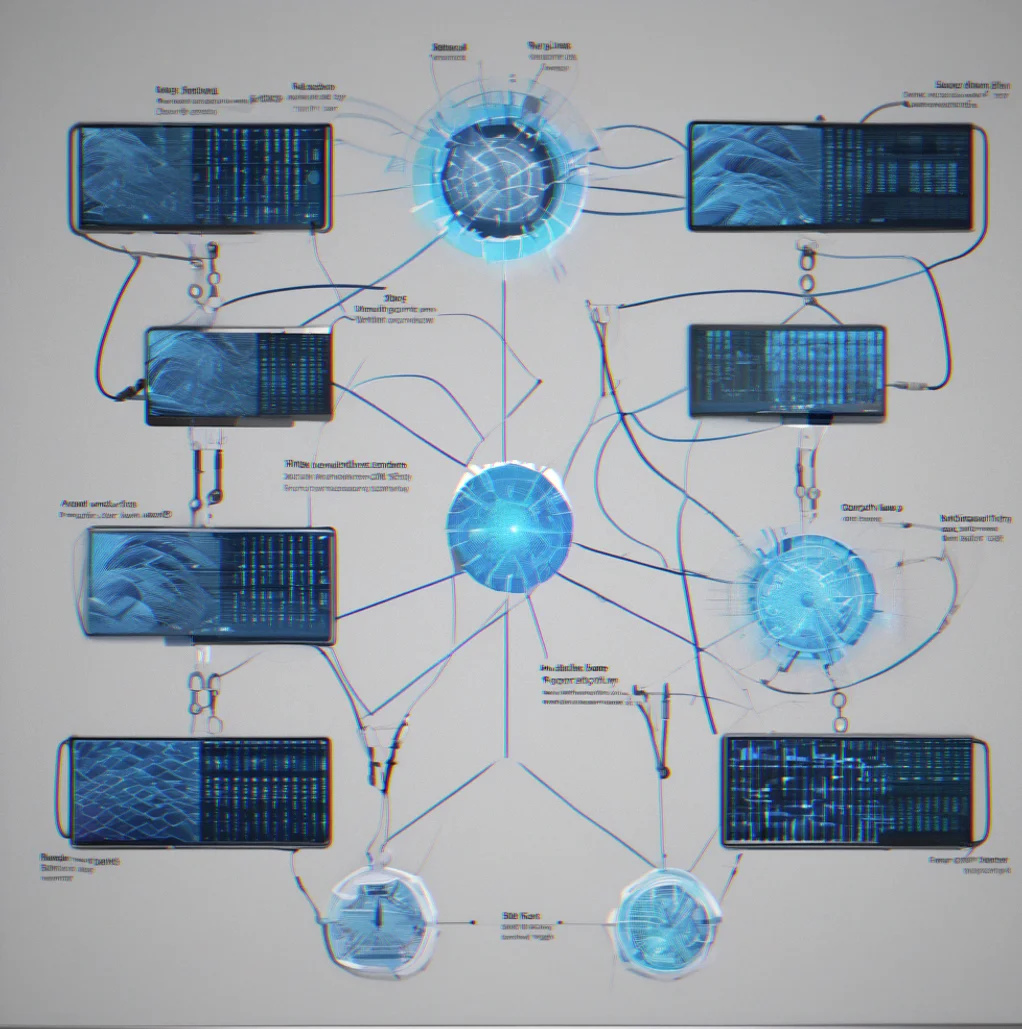
Signals coming in from five different tools, but your team only sees one clean thread
Last week three incidents needed someone to ask for clarification. That added up to over eight hours of wasted work. Most of it preventable.
Stop getting the same incident three times over
CloudWatch, Datadog and your custom monitoring all fire on the same problem. Instead of three alerts, you get one. The rest show up as context. You actually see what broke instead of watching the same message repeat across every tool.
Severity thresholds you can actually change
Critical means different things depending on who you ask and when. Set your rules once, tweak them whenever. Ignore warnings during deployments. Send security stuff to a separate channel. Want different handling at different times? Just configure it.

See where the time actually goes
From alert firing to someone actually acknowledging it—how many seconds or minutes? Is it the detection itself that's slow, the routing, or just your team being busy? Track each stage. You can't fix what you don't measure and this data usually drives real changes in how work gets done.
Find out what unclear alerts actually cost you
Bad alerts create extra work. Someone has to ask for clarification. A deployment gets rolled back because the alert was confusing. Track these incidents. Most teams realize within a month that this is where they're losing time.
How SilverSignal handles real scenarios
Finance: Transaction anomaly detection
Large payment systems pump out alerts for every weird transaction pattern. SilverSignal learns what normal looks like for you — spots the real anomalies instead of flagging routine spikes. Confirmed threats go to compliance, false alarms drop roughly 60% in month one.
Security: Incident prioritization by severity
SIEM tools dump logs everywhere. Thing is, not all threats matter equally. A port scan from your vendor's IP looks different from someone stealing credentials. Pattern recognition pulls out only what actually needs your team's attention right now.
Distributed systems: Deployment rollout clarity
Rolling out changes across hundreds of services means hundreds of status updates. SilverSignal bundles them into one view instead of drowning you in noise. Failures surface before they get buried in all the normal progress chatter.
Multi-team handoffs without context loss
Incident starts with platform engineering. Moves to security. Then database team picks it up. Each handoff strips away context — the original alert details, what you already investigated. SilverSignal keeps the full history intact through the whole chain.
Quantifying alert fatigue
Your team gets a hundred-plus alerts every day. Maybe eight of them get a response. That ratio is your baseline. Track it week to week. When it shifts, something changed in your infrastructure or your alert rules.
Breaking down where time actually goes
Alert fires at 14:32:01. Team gets notified at 14:32:03. First response comes at 14:32:47. That 44-second gap could be routing delay, notification delivery lag, or how long it took someone to decide what to do. Knowing which one tells you what to fix.
Identifying rework cycles
Incident gets closed, then reopens thrwe hours later because the team needed to ask what the alert even meant. That's wasted effort. When these patterns cluster, your alerts need clearer messaging.
Replaying past incidents for training
New person joins the team. Run last month's critical incidents through SilverSignal and show them what mattered, what got filtered, why decisions went a certain way. Beats explaining it in theory.
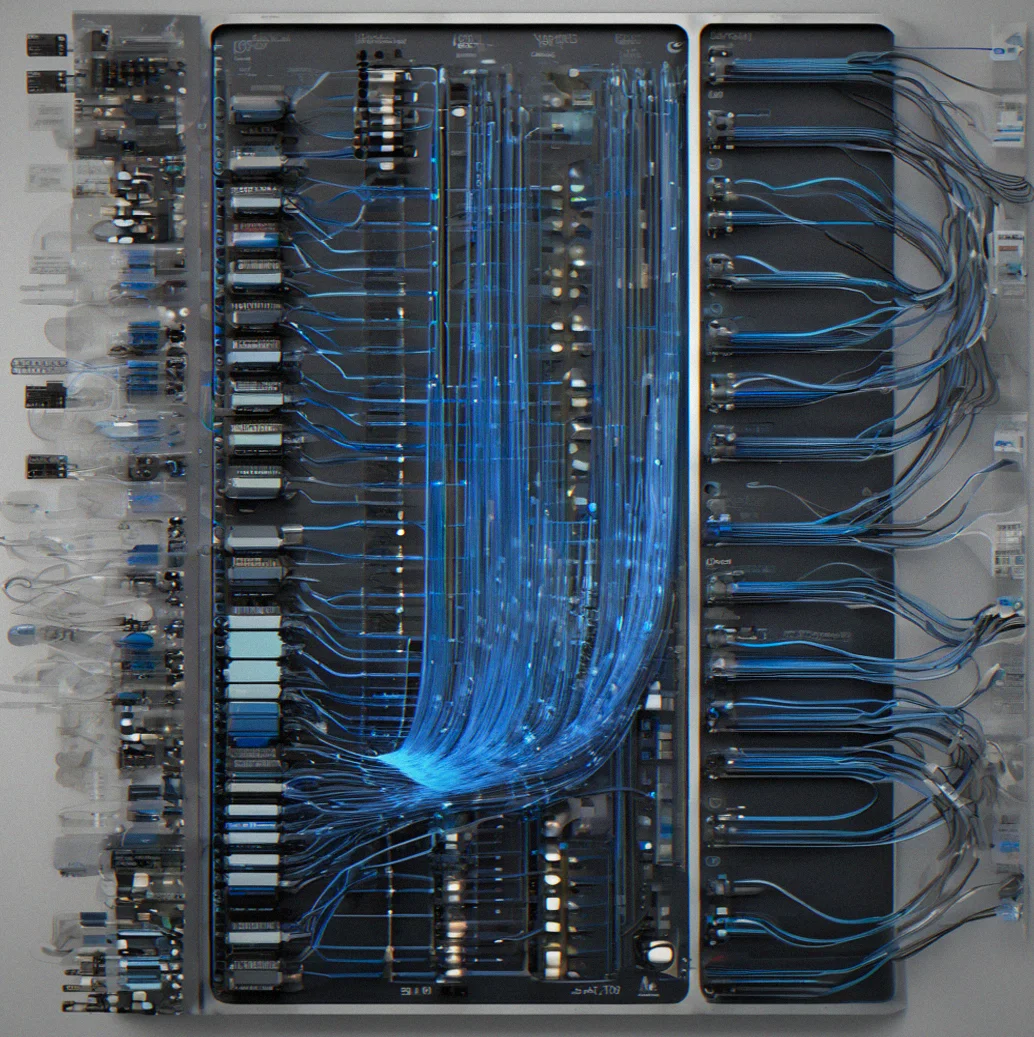
How signal filtering works


Frequently asked about signal filtering
How SilverSignal works, what it costs, and whether it actually reduces noise without hiding critical alerts.
No. It removes duplicates and low-confidence noise, not critical signals. You set the rules for what counts as critical in your setup. Alerts matching those rules show up immediately. Everything else gets logged but doesn't interrupt you. Most teams start conservative in the first month—just deduping obvious repeats. As the system learns your patterns, you can tighten things up. You're always in control.
Half an hour if you're just connecting one or two channels. Slack webhook, email forwarding, maybe a PagerDuty token. Setting up multiple channels across 5 different systems with custom rules usually takes a few hours. After that, your team tweaks the rules as needed.
Not out of the box. If you export logs from tools you already use—Datadog, CloudWatch, Slack archives—we can pull them in and re-filter them. Gives you a look at what filtering would have changed over the past month or so. Handy for comparing costs before and after.
It could happen. That's why SilverSignal doesn't delete anything. Critical signals hit your main incident channel right away. Less important ones go to a searchable archive where you can see confidence scores. If a staged alert matters later, it's still there with all the context. You can adjust rules after the fact. The point is cutting noise, not being perfect.
Per seat. Teams up to 5 people pay $149 monthly, then $29 for each additional person. No setup fees. Includes unlimited alert ingestion, 90 days of history, and rule changes. Custom integrations or dedicated support run between $500 and $2000 depending on what you need. Most teams break even in two months once you factor in less burnout and less time fixing things twice.
Each team gets its own filtering rules and dashboard. You can also set rules across teams when it maeks sense—route certain security alerts to a shared channel, sync incident status, that kind of thing. Infrastructure team sees infrastructure signals. Security sees threats. Product sees application errors. All filtered separately but they connect when needed. One audit trail for everything if you want it.